Visual Studio IDE
 Visual Studio for Mac
 Visual Studio Code
Debug in the cloud
Target the toughest errors with powerful debugging and diagnostics

Understand your code
Find your code's references at a glance
Instead of digging through several windows to retrieve essential information such as the last time a line of code was changed, and how many times it was changed, find it at your fingertips within the code editor. See references to your code, work items, code reviews, linked bugs, contact code authors, and discover unit tests.
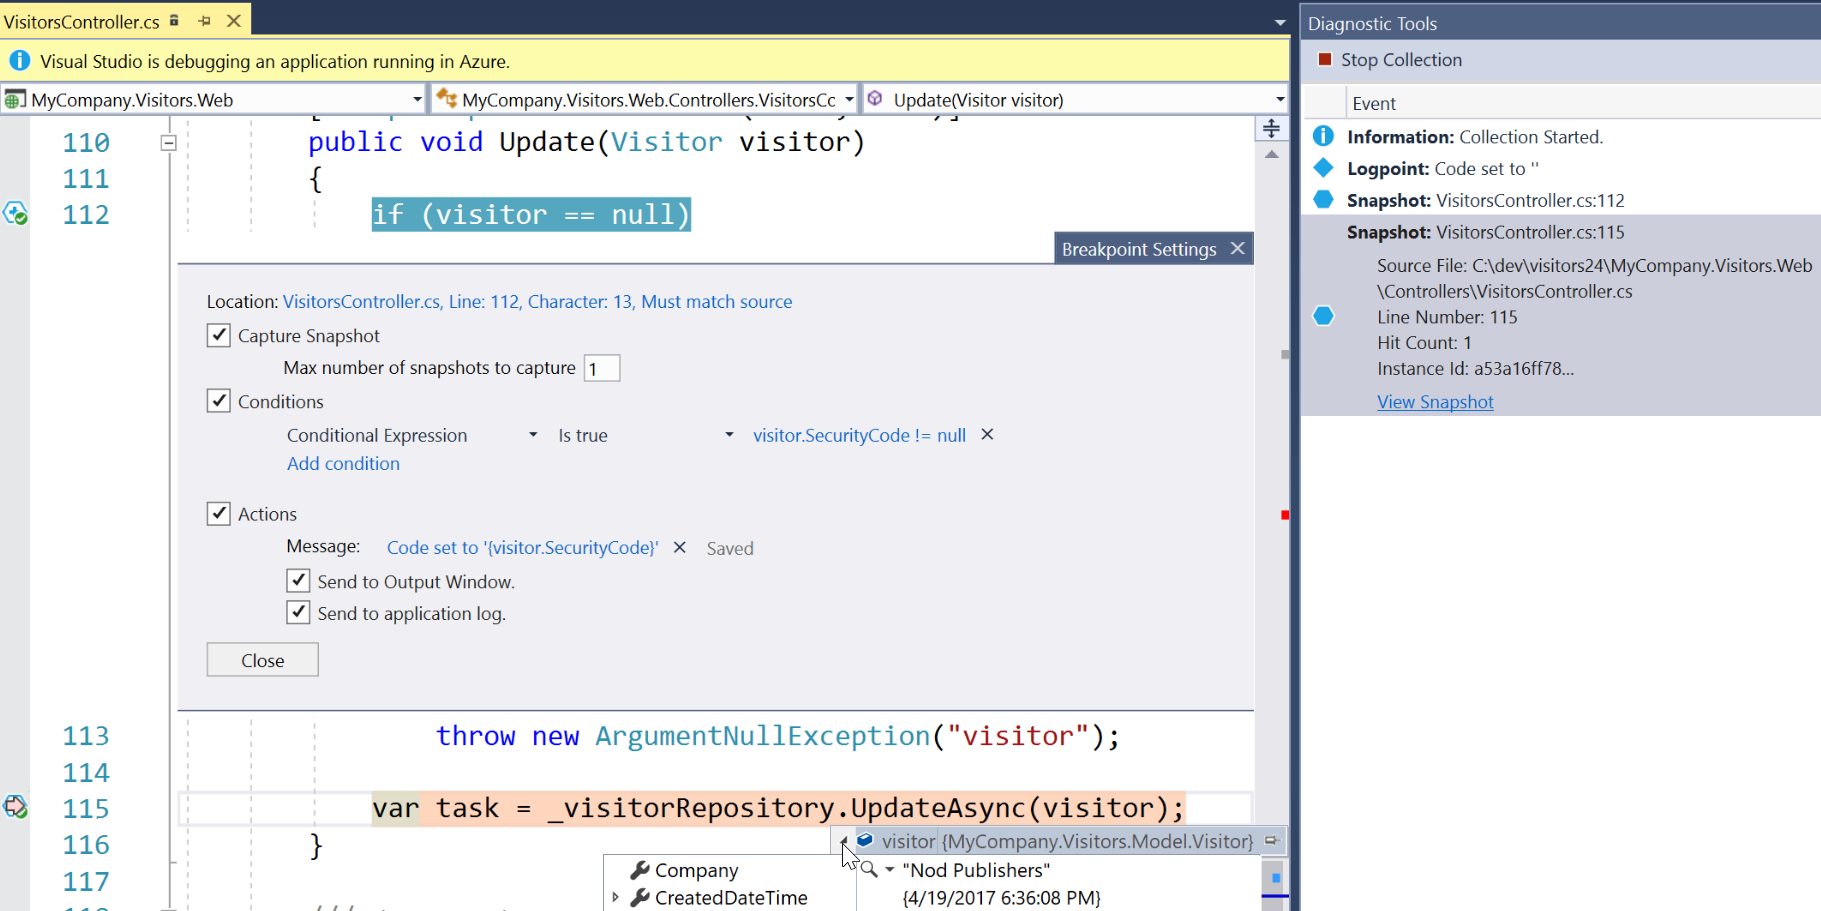
Interactive Snappoints and Logpoints
Understand exactly what is happening at any line of code in production
Unlike remote debugging with breakpoints, Snappoints do not halt your application when hit – instead, they capture a snapshot of your app’s state and continue running. You can therefore use Snappoints to debug a live site with minimal impact to any end users hitting the site. The other equally non-invasive feature called Logpoints enables you to insert new logging statements in your app on-the-fly, without any code changes or redeployments.

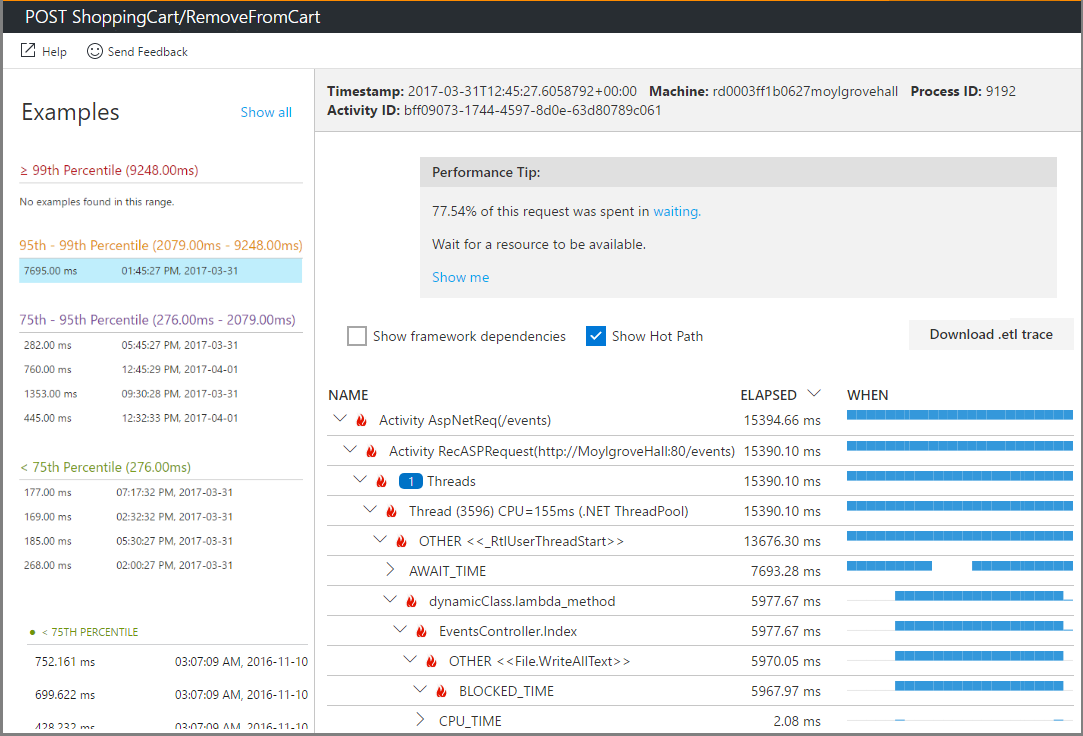
Find errors quickly with correlated traces
Tracking errors across a distributed apps is now built-in
Distributed applications are nothing new, but the difficulties of finding the root cause of exceptions in a distributed system are still a challenge to solve. Until now. With Correlation IDs built into Application Insights, you no longer have to manually handle tracing a transaction across multiple microservices or components, it’s now just part of the cloud.
Solve performance issues with production profiling
Find out which methods are slowing down performance for your users
Production problems are more than just exceptions. Performance issues can cause just as much trouble as exceptions and can be even harder to track down. Take the easy path to improving your applications performance with the Application Insights Profiler.