Quickly find bugs
Inspect, diagnose, and profile with ease using the latest Visual Studio
Debug cross-language
Rich debugging for all your code
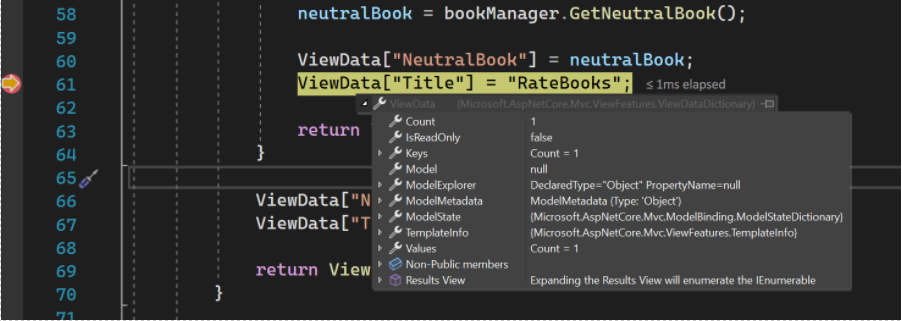
Instantly view information about your variables in the editor while debugging. Use Data tips to see the name and current value of a variable, to expand an object and see its elements, and to edit the value of a variable.
Any platform or place
Locally, remotely, and in production
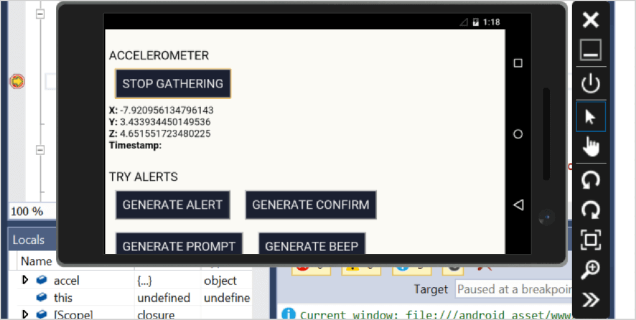
Anywhere your code runs, Visual Studio can debug it–from launching a local Windows app on the desktop or in the Android emulator, to attaching a remote Azure instance, iOS device, or gaming console; or to any web browser.
You can debug issues offline in your production environment using capabilities such as IntelliTrace and deep analysis of dump files.
Fine-grained control
Decide exactly where and when you want to break and pause the application execution
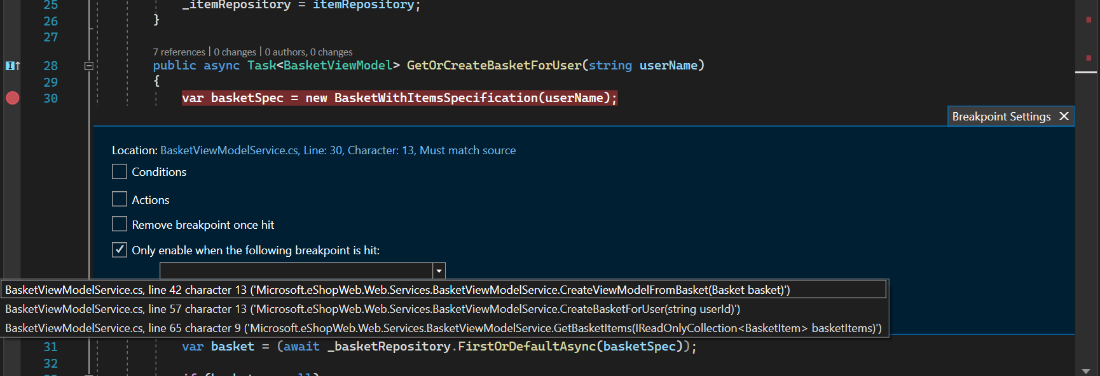
Use breakpoints to pause your running program where you suspect there is a bug. Take things to the next level, by using advanced breakpoints with conditions and actions to evaluate more complex scenarios or use-dependent breakpoints to debug common paths in your application code easily.
Jump into debugging mode at a specific line is much easier using run to run to cursor or fast forward your debugging without losing your breakpoints with Force run to cursor.
Flexibly inspect state
Its the same image just in dark theme
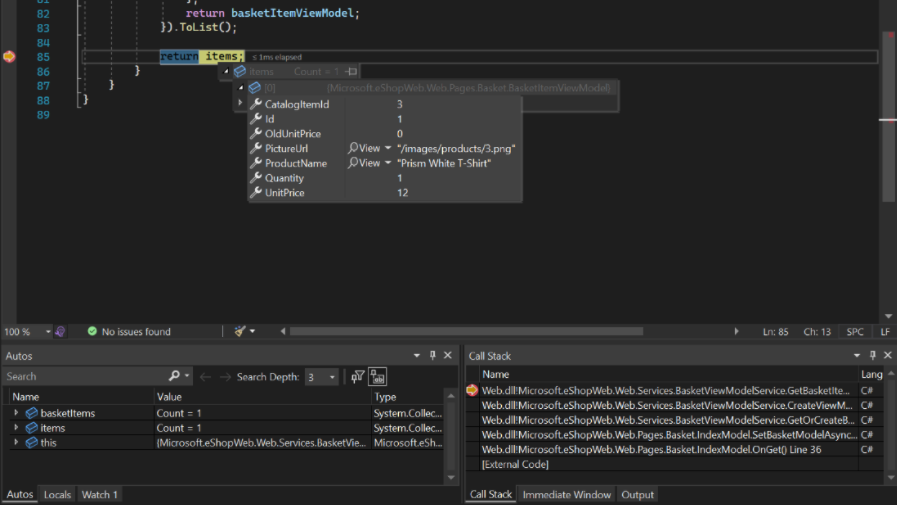
Once you pause the application where you want it, Visual Studio offers many ways for you to inspect the value of your variables, to form or verify a hypothesis.
Monitor a value while stepping through your code; glance at local variables, and evaluate complex expressions–all without leaving the debugger. You can even interactively query deep into a data structure.
Get alerted when things go wrong
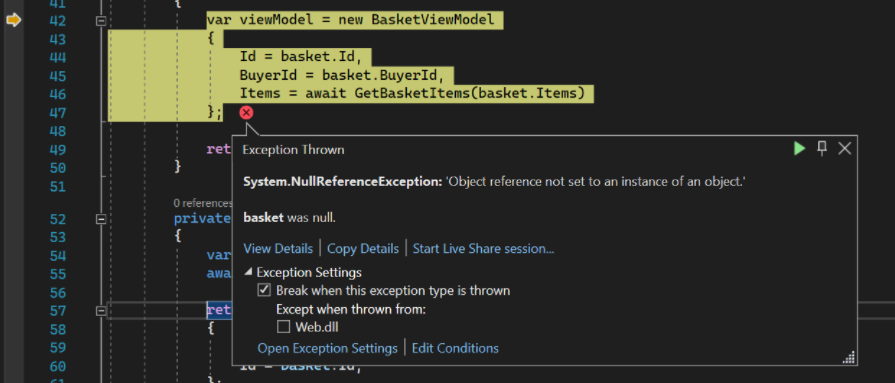
Code defects and unexpected situations manifest themselves as exceptions. Exceptions will crash your app or simply become hard bugs to track down.
While debugging with Visual Studio you can configure notifications when exceptions are thrown, and even choose specific exceptions of interest to focus on. You get alerted immediately with inner exception information and null reference analysis right from there, as easy as if you had hit a breakpoint.
Simplify control and inspection of complex multi-threaded code
Multi-threaded code is notoriously tough to debug. Visual Studio lets you control the execution of multiple threads at once and inspect state across many threads to make the big picture pop.
See all the thread call stacks in a single graphical view and evaluate expressions across multiple threads to compare values. Easily view information about threads and tasks, flag them, and freeze them. Quickly switch between execution contexts, and use thread markers to see which lines of code your threads are executing at any moment.

Dig as deep as your code requires
Sometimes, especially for system-level C++ code, you need to drop closer to the hardware level to diagnose hard to find bugs. Visual Studio supports you to get this done with the Memory, Registers, and disassembly window.

Make your app fast and robust
Get information to help you make good performance choices as you code. Use in-editor PerfTips and diagnostics tools to understand the performance and memory characteristics of your code while you’re debugging.
Use comprehensive profiling tools without the debugger to get deeper insights into your app’s performance, including CPU, GPU, and memory usage, UI responsiveness, and network utilization.

A tool for all your needs
Whether you need to analyze CPU usage or track down unwanted memory allocations with the .NET Allocation tool, the Performance Profiler has a tool to drive your performance investigation.

Visualizations to help you discover performance issues
The performance profiler is rich with visualizations such as the flame graph in the CPU usage tool, to track down which code pathways are taking up most of your CPU’s time. When you have found a function of interest in the call stack, go straight to your source code to make performance improvements!

Performance insights at a glance
Get insights fast with the summary page in the CPU usage tool! The top function, hot paths, are highlighted for you so you can get straight to the cause of your performance issues.

No more “no repro”
Code execution history for .NET code
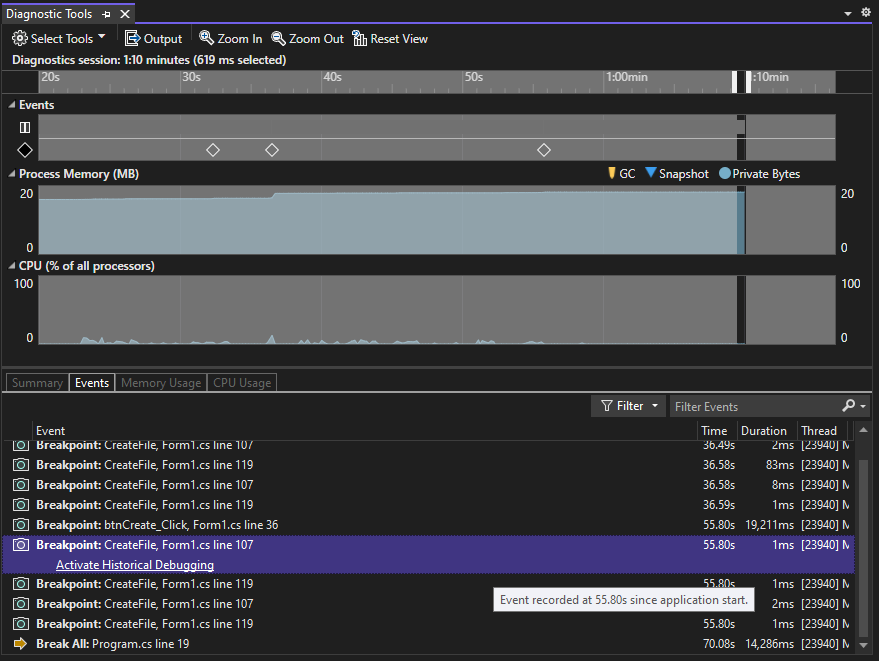
As you edit and F5 to test your .NET code, you encounter an unexpected behavior, a bug. Diagnosing that bug can sometimes take hours of searching through source code to find the relevant pieces of code and repeated guesses of where to set a breakpoint.
With Visual Studio diagnostic tools and IntelliTrace you can see the history of your code’s execution and navigate back to inspect state without breakpoints.

 Visual Studio Code